
![]()
![]()
![]()
![]()

Books |
EU degenerates: Immiserizing Growth
Sottotitolo:
The mercantilist drive for “competitiveness”, a trade surplus, has substantially reduced the benefits of growth. In the online Encyclopedia.com we read, Economists for well over 200 years constructed mechanisms by which economic growth – an overall increase in domestic production – might result in national impoverishment. For David Ricardo the mechanism was job destroying technical change; for Marx a falling average rate of profit was the culprit; and, more recently, free trade advocate Jagdish Bhagwati suggested a sharp deterioration in the prices of a country’s exports as the villain. Intense controversy has plagued all models of immiserizing growth. Until recently they were considered at most remote theoretical possibilities. In one of the more startling outcomes of this young century, countries of the European Union have achieved exactly that, growth that leaves national populations worse off. For the welfare of the residents of a country, the appropriate test for an economic recovery is its impact on the goods and services available to people to purchase and use. This is measured not by GDP but domestic expenditure, by households, businesses and the public sector. If domestic expenditure falls, the current welfare of the population has declined. It may seem obvious that an increase in domestic production results in more goods and services for the population. A moment’s reflection shows that is not true. A recovery characterized by a declining deficit in external trade or an increasing surplus means that goods and services available to a country’s population increase less than total production. The critique of mercantilism by Adam Smith in the second half of the 18th century focused on this negative welfare effect of trade surpluses. Chart 1 shows a sorry story for 19 euro zone countries and the nine EU members with national currencies. The vertical columns measure the change in domestic goods and services, those available to the population of each country, from the beginning of 2008 through the second quarter of 2017. Over these ten years (41 quarters), for only four euro zone countries was the increase as much as one percent a year (cumulative 10% percent). These four are among the smallest countries of the 19 member euro zone (Malta with the smallest population, Luxemburg second smallest, Estonia fourth smallest and Slovakia 11th). At the other end of the chart the change was negative for five countries, two of which are among the largest members (Spain and Italy). Only one of nine non-euro countries showed a negative change (Croatia).
Chart 1: Percentage change in Domestic Expenditure, 19 euro zone countries & 9 non-euro countries, 2008Q1-2017Q2 Source: Eurostat. This is a dismal outcome by any assessment, real domestic improvement of a meagre 0.5% per year across the euro zone and barely above one percent annually for non-euro countries. The result is all the more dismal when we focus on the euro zone countries (Chart 2). In every country but one rising trade surpluses left the increase in domestic goods and services well below the increase in gross domestic production. To put it simply, the mercantilist drive for “competitiveness”, a trade surplus, has substantially reduced the benefits of growth. During 2008-2017 Irish GDP increased by 35% while the domestic availability of goods and services rose by less than 10%. Even more extreme was Portugal, where the export boom left residents worse off. GDP increased by 30% and domestic goods and services fell by over 5%.
Chart 2: Percentage Change in GDP and Domestic Expenditure, 19 euro zone countries, 2008Q1-2017Q2 Source: Eurostat. To add insult to injury, the function of the trade surpluses of several countries has been to service public sector debts owed to foreign banks, Greece and Ireland the obvious examples. Earlier I referred to the “sorry story” of EU immiserizing growth. The full story is sorrier still. Beginning in 2010, through one ad hoc mechanism or another, governments of country after country in the euro zone were pressured to introduce austerity policies. These policies sought to reduce fiscal deficits by expenditure cuts. The deficits themselves resulted from the global economic contraction of 2007-2009, which also caused the near collapse of commercial banks in the austerity-blighted countries. Large loans to Greek, Irish and other governments from banks in the global financial centres (Frankfurt, London, New York, and Paris) prevented those near-collapses (“bailouts”). The expenditure cuts depressed growth rates, which reduced household incomes. Lower household incomes meant lower imports, so trade deficits declined and became surpluses. What seemed disastrous to common folk in Greece, Ireland, Portugal and other countries, falling incomes and falling consumption, generated trade surpluses to pay the debts contracted with foreign banks. The often predicted and sluggishly realized economic recovery of the EU economy can be summarized in a phrase: fiscal austerity for trade surpluses to service the loans contracted from one set of banks to bail out another set of banks. John Weeks
Professor Emeritus & Senior Researcher, Centre for Development Policy and Research |


 https://braveneweurope.com/wp-content/uploads/2018/03/Graph1.4.png 924w" style="border:0px;vertical-align:bottom;height:auto;" width="615">
 https://braveneweurope.com/wp-content/uploads/2018/07/graph-2-immiserati... 768w,
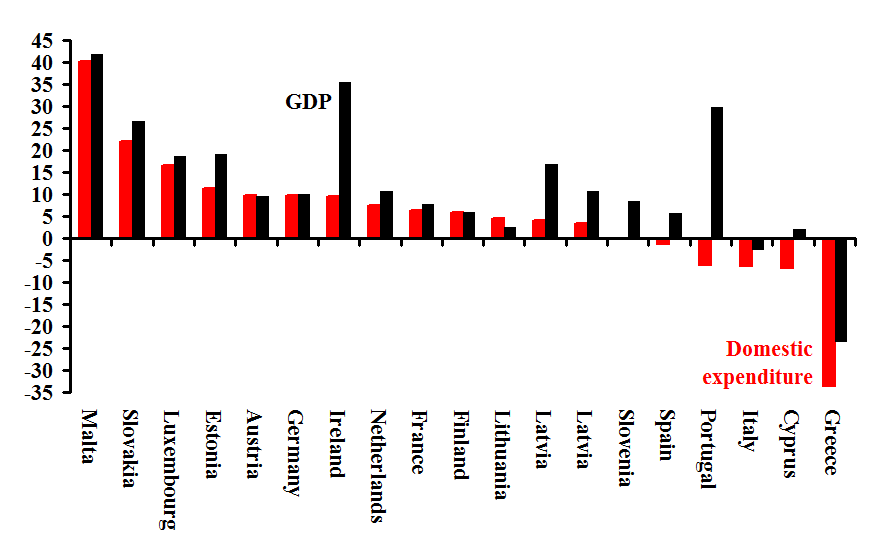